What a Production Rate Measures and What It Quietly Leaves Out
A production rate, in janitorial work, is the amount of area a cleaner can cover in one hour, usually measured in square feet per hour for a specific task. It turns a floor plan into labor hours, and labor hours into a bid. This is the backbone of estimating, scheduling, and workforce planning.
But a production rate is not a stopwatch on every movement. It measures only the core cleaning task: vacuuming, dusting, mopping, or restroom servicing. It does not include everything that happens between jobs: walking to the supply closet, emptying vacuums, refilling soap, or waiting for elevators. Those minutes add up, especially in buildings with many levels or scattered spaces.
Production rates also leave out the "load-in" and "load-out" time. This is the period before and after cleaning when supplies are gathered or equipment is put away. Rates assume supplies are stocked and staff are familiar with the building. For new accounts or unusual layouts, real working time can be noticeably longer than any published rate suggests.
Keep reading: Bidding a 40,000 Square Foot Medical Office, Line by Line
Where Published Task Times Come From and How to Adjust Them
Most published task times come from controlled job studies, where observers time experienced cleaners under ideal conditions. These benchmarks are published in industry guides and used to set general standards. For example, you might see a rate of 2,500 square feet per hour for damp mopping, or 10,000 square feet per hour for dust mopping, under certain assumptions.
In real buildings, task times can run longer or shorter. Several factors push rates up or down. Floor clutter, the number of trash cans, tight corners, and frequent interruptions all slow production. Wide open spaces with minimal furniture, clear walkways, and consistent surfaces speed it up. The age and experience of your crew also play a role, as do the quality of tools and equipment.
Adjusting a published rate means looking at your specific conditions. If the standard says 3,000 square feet per hour for vacuuming in an open office, and your location is packed with cubicles, you'll want to reduce your expected coverage. If you have commercial upright vacuums and large, straight runs, you might use a higher rate. Always adjust downward for new accounts or locations with strict security and badged entry.
Open Plan, Cubicles and Classrooms: Why Density Changes Everything
Density is the silent variable in production rates. Open plan offices, with rows of desks and few walls, allow for fast coverage. A cleaner can vacuum or dust a large area with little stopping and starting.
Cubicles slow work. Each divider, chair, and file cabinet means extra maneuvering. Plugging and unplugging vacuums, moving chairs, and reaching under work surfaces can cut the vacuuming rate almost in half compared to a wide-open hallway. Dusting, too, takes longer, as more surfaces need to be wiped and more items moved and replaced.
Classrooms sit somewhere between. Rows of desks slow the pace compared to a gymnasium but are faster than cubicles. In schools, the number of whiteboards, shelves, and sinks also changes cleaning time. Libraries, with tight stacks and many surfaces, are among the slowest spaces to clean.
For every change in density, the production rate shifts. The same square footage can take vastly different hours, depending on how tightly it is filled.
Keep reading: Strip and Refinish vs Scrub and Recoat: Cost and Downtime
Restrooms Are Priced by Fixture Count, Not by Square Foot
Restroom cleaning stands apart from open space cleaning. Here, the main driver of labor is not the size of the room, but the number and type of fixtures: toilets, urinals, sinks, and partitions.
A small restroom with four toilets and three sinks can take longer to clean than a larger restroom with two fixtures. Each fixture must be cleaned, disinfected, and checked for supplies. Floor size matters less, unless there is significant mopping or special flooring to address.
In most commercial bids, companies use a per-fixture rate, estimating the minutes or fraction of an hour needed for each. Busy restrooms get extra time added for restocking and spot checks. Showers, changing tables, and baby stations also raise time requirements.
For accurate pricing, walk every restroom and count each fixture. Adjust your base time if the fixtures are heavily used, prone to graffiti, or require special treatment like stainless steel polish.
Hard Floors: Vacuum Width, Scrubber Path and Realistic Coverage
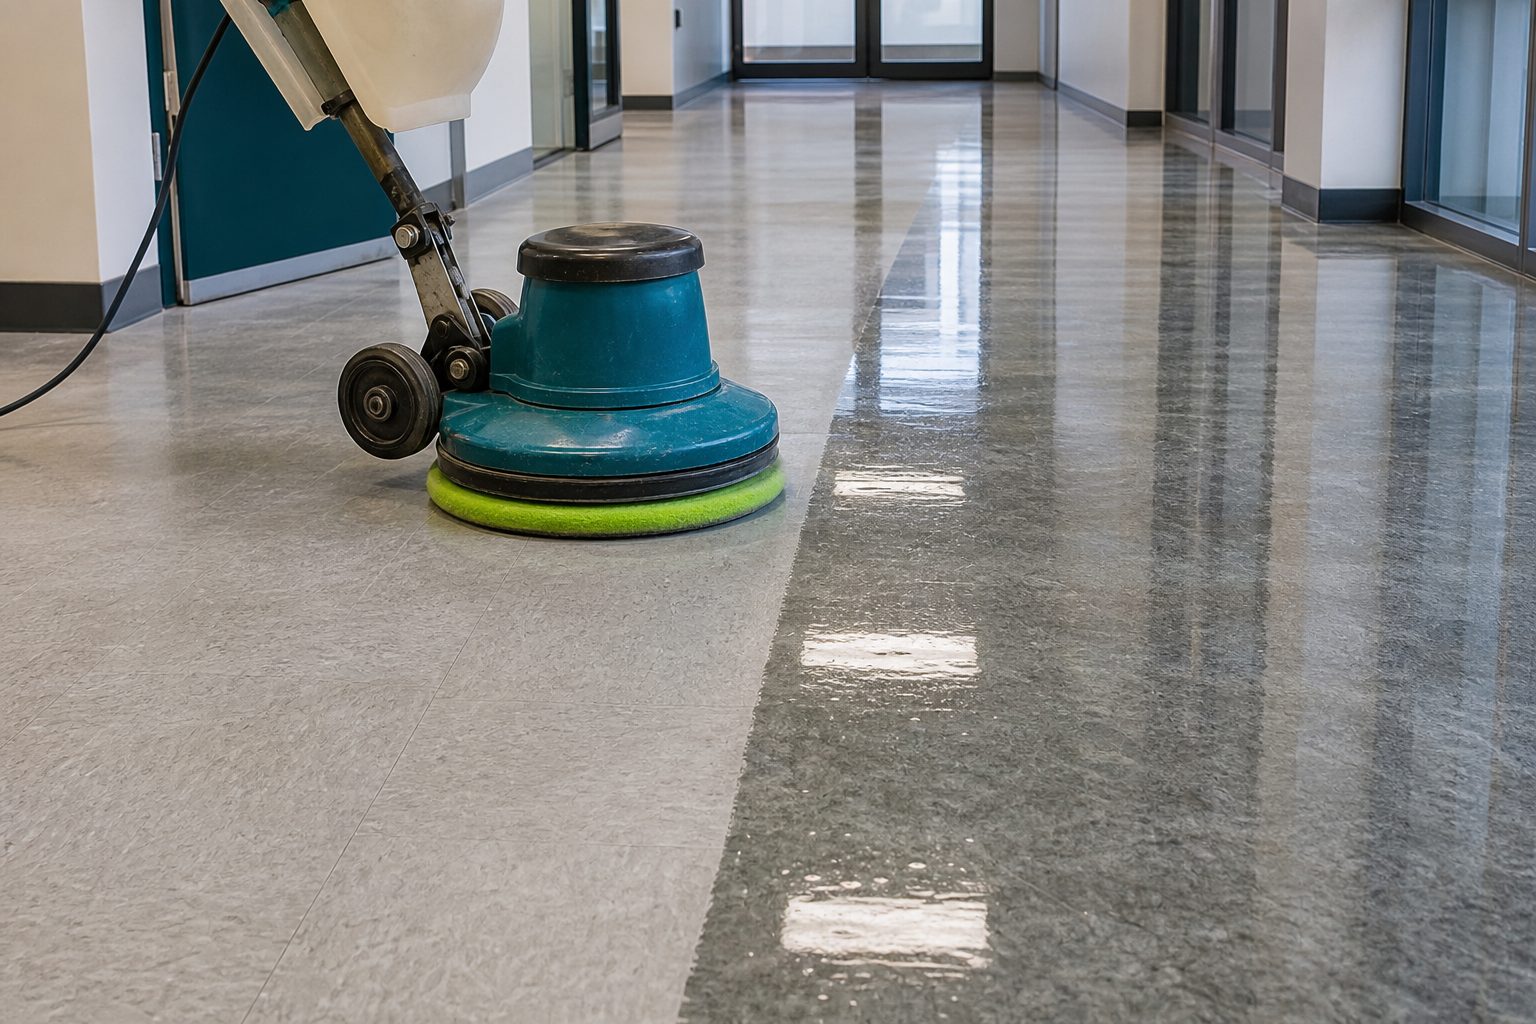
Hard floor maintenance, whether dust mopping, wet mopping, or machine scrubbing, is all about path width and obstacles. A wide dust mop or floor scrubber covers more ground with each pass, so rate tables usually assume a specific tool size.
A 24 inch dust mop may cover 7,000 to 10,000 square feet per hour in a wide hallway. Switch to a 12 inch mop for tight areas, and coverage drops by half. If the floor has many doorways, posts, or furniture, expect even lower rates.
Walk-behind scrubbers are rated by their path width and tank capacity. A 20 inch scrubber may clean a school hallway quickly, but will take longer in a kitchen with tight aisles. Edging and detail work always slows down the total area covered per hour.
For first time or deep cleans, production rates fall. Additional passes, dwell time for chemicals, and hand scrubbing corners all add minutes. For most recurring jobs, a consistent tool set and a regular sequence help crews hit their expected rates.
See how MopRoute handles this for commercial cleaning
Timing Your Own Crews to Build a House Rate Table
Published rates can only take you so far. Each company, crew, and job site is different. Building your own rate table starts with timing your crews during real shifts.
How to Time Tasks
Pick a representative sample of jobs. Record the start and end times for each task: vacuuming, dusting, restroom cleaning, and floor work. Make sure to note the area cleaned and the number of fixtures serviced. Repeat this for several days and across different staff.
Exclude non-cleaning time, like breaks or supply runs, but keep setup and takedown in mind. Use averages to smooth out odd days or unusual events.
What to Watch For
Look for bottlenecks. If restrooms take longer than your baseline, is it due to heavy use, broken fixtures, or missing supplies? If vacuuming slows down, is it the density, the condition of the carpet, or equipment problems?
Take notes on anything that pushes the time up or down: late-night access, lights not working, or tenants still present. Over time, you will see patterns and learn when to adjust your rates.
Building Your Table
Collect your real world times and compare them to published numbers. Create your own chart for each major task and building type. For example, you might find your team averages 2,200 square feet per hour vacuuming in dense cubicle space, but 4,500 in open corridors.
Update your table every quarter or after a major account change. As your crew improves or changes, rates will shift. Make it a living document, not a static chart.
Turning Rates Into Hours, and Hours Into a Monthly Price
Once you have a rate table, estimating a job starts with a walk-through. Measure areas, count fixtures, and note density. Multiply each area by the rate for that task: an open hallway at 4,000 square feet per hour, restrooms by fixture, cubicle space at 2,000 per hour, and so on.
Add the hours for each task to get a total for one cleaning. Multiply by the number of cleanings per month. This gives you the labor hours needed for that account. Factor in setup, lock-up, and travel time as overhead, usually added as a percentage or as a fixed block of time.
Turn labor hours into a cost by multiplying by your wage rate, adding payroll taxes, and including a margin for overhead and profit. This becomes your monthly or per-clean bid.
Keep your process consistent. Document the rates and assumptions you use. If a job runs long, check whether the production rate or the task count needs updating.
For operators with multiple routes and properties, recurring route scheduling tools with per property checklists and photo-verified completion make it easier to keep production rates accurate and jobs on track. These systems help spot slowdowns, document work done, and keep estimates grounded in real world results.